|
|
Salesmatrix V4
First Time Quick-Start Walk Through
After completing the installation, launch Salesmatrix V4 (from the
Start/Programs menu).
As there are no previously opened datasets the choice list will be blank, so click on the Data Locations
button. You will see a directory called "HealthSnax_Demo". Open that
folder and choose the file called "smatrix.DBC".
Salesmatrix will open the dataset and the first screen will display Products
by Period view. The demonstration company is a wholesale company selling
vitamins, health food and cosmetic products.
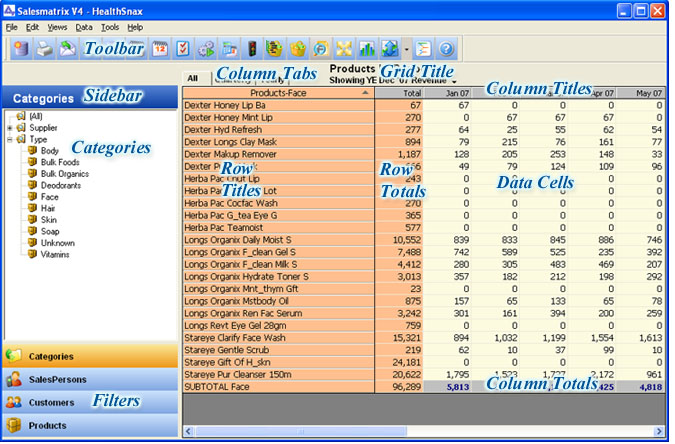
The Grid
On the screen you will see a coloured toolbar beneath the menu, a sidebar
with the heading "Categories", the grid with Product names listed
down the left and Monthly periods listed across the top.
This is the 'Grid' and is the centre of most Salesmatrix activity. Because
there is very little data entered into Salesmatrix, the interface has been
designed to be mouse-centric. The following mouse actions assist data display:
Column Titles: clicking will sort columns from top to bottom, and on a
subsequent click the reverse order, from bottom to top.
Cells: double clicking on a data cell will drill down behind the data to reveal
the other dimensions of the cell results, in this case the Customers and
Salespersons involved in the product sale.
Total Column: double clicking on a row total will sort the columns from highest
to lowest across the page.
Row Titles: double clicking on a Product description will launch a
Product intelligence screen where more details on the product can be calculated
and viewed.
Sidebar Categories. Clicking on a category heading (eg Type) will summarise the
products by type on the grid. After expanding the category heading, clicking on
a category item will filter the grid to show just those products.
At the bottom of the sidebar, there are three filters corresponding to the three key dimensions of the
Salesmatrix data - Customers, Salespersons and Products. Click on the
Salespersons button and then choose one of the names from the list that is
created in the sidebar. You will see the grid change and display just the
products sold by that salesperson.
|
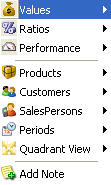
Right-clicking the mouse on the grid pops up a handy menu which allows the grid view to
be changed both in the value displayed and the dimensions displayed. Under the
heading Values, choose 'margin' or 'units' and you will see the values in the
grid change to the value chosen. Change back to Revenue for the remainder of
this walk-through.
Imagine the Salesmatrix environment as a dataset reflecting the business
equation 'Customer buys Product from Salesperson in Period' or
Customer x Product x Salesperson x Period. On the grid we can display any two
of those four dimensions, and each gives a unique perspective of the results
within the current dataset.
To demonstrate this from the right-click menu choose 'Products by Salespersons'. You will see the
grid dimensions change. Products will be listed down to the left of the grid,
one per row, and across the top of the grid, Salespersons are displayed in
the columns.
|
 |

|
Click the button on the toolbar with the traffic light icon. You will see traffic light
colours displayed on the grid. To understand how these colours can assist
understanding the data patterns on the grid, click twice on the second column
header (the word 'Total'). The highest selling product should be at the top of
the grid, and across the grid you will see the comparative selling patterns. A
lighter colour (say a yellow) or a red in a cell where the total column has
dark green, means that this salesperson is not following the general selling
pattern/ratio for that product.
Right click and choose Salesperson by Period. Here you will see a new pattern
of traffic light colours on the grid. You should see some cells with dark green
colouring which shows a good month's sales for that particular salesperson. |
Drill-down Intelligence
What did the salesperson sell that month and to what customers? Simply double-click
on the cell. The Cell Details screen shows what lies behind the results
displayed on the grid. Additional Tabs show the details of the other
dimension (E.g. if you have Salespersons by Period displayed on the grid,
the customers sold to and the products sold will be listed)
|
|
At the bottom of the Cell Details screen you will see buttons enabling the
information to be:
|  |
printed,
|
 |
copied and pasted into other programs,
|
 |
emailed, or
|
 |
reported in an HTML format.
|
Close the Cell Details screen.
Double-clicking on the row descriptions in the first column of the grid can
access Customer, Product and Salesperson intelligence centres. Depending on
Row-type, there are a number of different options to show possible
opportunities.
Explore the information here and note that it can be output directly to
email, a perfect way for a busy Sales manager to communicate issues and
opportunities to the Sales team!
|
Right-click on the grid and change the view to Customers by Period. Among other
information the customer centre can display
- the products a customer has purchased in the past but
not lately,
- what other customers in the same classification
are also buying, and
- the products that are usually purchased at the same time as those the customer has bought.
|
 |
In the Salesperson centre, a list of customers that
haven't been sold to in the past months can be displayed, as can the products
that haven't been sold recently.
Close the Intelligence screen
The Toolbar


|
All grids can be output to Excel. Click on the Excel icon to see the current
grid transfer into that program. Other output from the grid can go to Printer,
HTML and directly to your email.
|


|
The standard periods can also be altered to another custom period type. The
period lengths can be daily, weekly right up to annual. Click the Calendar button with
a tick on it to alter the period settings, the plain calendar button to choose
the alternative periods to diplay on the grid.
|


|
There are three buttons that produce graphs - the season button which shows
this year versus last, and the Row and Column Chart buttons. The latter two offer a
huge variety of options for presenting information from the grid in a graphical
format. After opening the graph view by clicking on one of these buttons, click on the
'Show Graph Options' button in the bottom left of the graph screen to open up a
side-bar area which allows other rows or columns adjacent to the current one
to be shown, and also to alter the type and settings of the graph.
|

|
After exploring the graph options, close the graph screen.
Within Salesmatrix there are also some custom market assessment routines. From
the tools menu choose Assessments, or click on the icon in the toolbar.
From
the Dropdown box labelled Assessment, choose 'Customers Retention'. In the
options area click of the button titled "Last 3 months". In the
dropdown entitled "Store to Customers Category" Choose a customer
category that the results can be overwritten to. If you have any titled
'Unused' or 'Catn' these are good candidates. If your average sales are smaller
than 100, then enter an appropriate value in 'Revenue value Threshold'. Click
Calculate. After the results are returned you will see the numbers of customers
that fall into each category. Close the Assessments Screen. On the grid,
right-click and choose Customers by Period. In the Sidebar click the small '+'
to the right of the word Retention. This will expand the categories out. To
view the customers lost click on the word 'Lost'. You will be presented with
the list of those customers who have not purchased from us in the past 3 months
and the amount they have spent in the past.
|

|
Within the salesmatrix framework we can view a whole business, or just a subset
of it - for example one salesperson, customers from one region, or one type of
products. To create a subset of just Chemist customers choose File/Create
Subset . Click on "Equals" in the customer are, and choose Type, and
Chemists. And then click the Select button. At the bottom right of the screen
choose the button 'Create New'. Click 'Yes' to create a new set, then type in
the new dataset name eg 'Chemists'. Choose 'Yes' to open the new dataset. Now
you will have a new set of data containing just the transactions that were made
by the Chemist customers. Right-Click on the grid and change to Products by
Customers to show the Products each of the Chemists has purchased.
|

|
To look at
what the important products are in this sector, choose the Focus button from the
toolbar. Move the lower 'Customer' slider to the very right (100%) and then
drag the horizontal 'Products' slider down to 20% (or 25 products) and then
click the button 'View Focus'. The grid now shows the values from the focus set
chosen. Now you have a clear view of potential opportunities that exist in this
sector. A very easy way to see which customers could be buying more from us!
When you have finished viewing this focus set, simply click the focus button in
the toolbar to return to the complete 'unfocused' data.
|

|
To return to the original dataset, choose File and New. You will now see two
dataset options 'Chemists' and 'Healthsnax'. Choose Healthsnax and click 'Ok' to return to the
full original set.
|
So there is a brief look at a few of the features and capabilities of
Salesmatrix. Other capabilities not explored include budget creation, Category
changes and other methods of opportunity analysis via the grid displays. Some
of these functions are covered in the 'How to'
section, so we invite you to review these sections also.
However the most effective way to explore Salesmatrix is with your own data.
If you don't have immediate access to a dataset relating to you business,
review the section detailing how to get your data into Salesmatrix. Chances are
you are using an accounting system that already has a script (set of import
rules) written that can be used to help you import your data. Check with your
software consultant or nearest
Salesmatrix dealer to see if this is the case. If you are unsure,
send Salesmatrix a request and
we will be happy to advise how best to get your data into Salesmatrix.
Copyright
|
